
Replace manual data entry with a connected workflow — field teams submit test results on-site using mobile, and managers review them instantly on desktop.
2020 - 2022
Strategy, Research & UX Design
Data & visuals restructed due to NDA
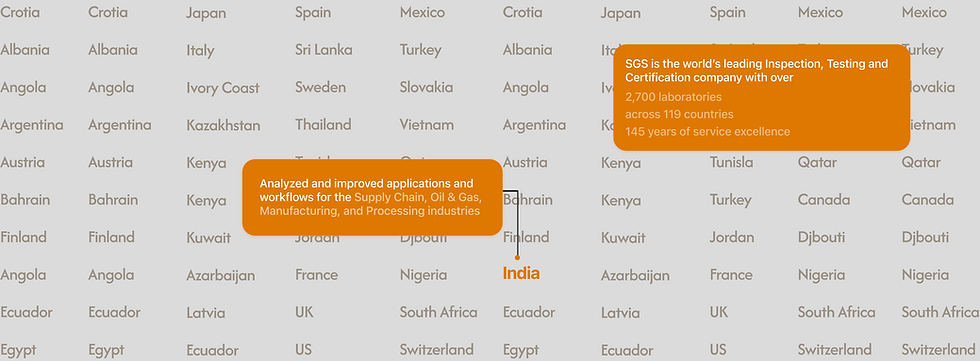
SGS, India
At SGS India, I designed app features that helped teams check product quality on-site, report updates quickly, and follow safety rules using mobile devices.
Replace manual data entry with a connected workflow — field teams submit test results on-site using mobile, and managers review them instantly on desktop.
At SGS India, I designed app features that helped teams check product quality on-site, report updates quickly, and follow safety rules using mobile devices.

Outcome
This project was a turning point in my design journey. Designing for field inspectors pushed me to think beyond screens and account for real-world conditions — gloves, motion, safety, and accuracy.
I realized how small choices, like button size or color contrast, could directly impact trust and compliance. Working closely with engineers, product owners, and end users taught me that design is more than visuals — it’s about creating tools that truly support the work at hand.
Most importantly, I walked away with a stronger sense of systems thinking, empathy-driven design, and a belief that enterprise tools should not just function, but empower people and create impact at scale.
User Flow

Best devices for our users

User Persona


Context
Field staff were using paper forms and Excel sheets, which often led to delays, mistakes, and inefficiencies. To fix this, the workflow needed to be digitized so data could be collected faster, reports could be more accurate, and inspectors, supervisors, and managers could make real-time decisions.
Background
Opportunity
Field staff in Supply Chain and Oil & Gas still relied on paper forms and Excel, leading to delays, errors, and inefficiencies. Digitizing the workflow was essential to streamline reporting, improve accuracy, and enable real-time decision-making.
Approach
Discovery → Research → Mapping → Prototyping → Testing → Improving → Evolving → Recommending


Original Workflow
Over 800 SGS Quality Inspectors and Auditors in Oil & Gas and Steel Plants use Paper forms and Excel spreadsheets to record readings, monitor production processes, and report findings.
Why was this system followed?
Familiarity
Limited access to technology
Simplicity
Lack of urgency

Why Change?
Engineer had to write data on paper, then re-enter it into Excel, and finally email it to managers.
Manual entries and validations from printed reports stretched engineers hours and caused delays.
Manual entries and validations from printed reports stretched engineers hours and caused delays.


.jpeg)
.jpeg)
to design the right solution, we first stepped into the users’ world.
Empathizing
The Big Questions
Making Sense of It All
I spent time with users, listening and observing to understand their real challenges
Could reports be faster? Are phones safe to use? Does the environment hold them back?
Turning messy notes into patterns, highlighting pain points & spotting area of improvement
Why digitize?
"How interested would you be to switch from current system to an Enterprise application?"

32 out of 40 users that we interviewed, agreed to this statement

System Blueprint
Think of ConOps as the game plan for our enterprise app—it answers the big questions: Who’s using it? What’s it for? Why does it matter? It’s the bridge between understanding user needs and creating a solution that works for everyone.
What questions are answered in ConOps?
What the app does and why it's essential?
Mapping roles of employees and clients


Rakesh B
Quality Inspector
Rakesh Bhandiwadekar, a 35-year-old field inspector with 8 years of experience, works in remote locations with limited connectivity. He needs an easy-to-use mobile app that allows real-time reporting, offline functionality, and efficient task tracking. His goal is to complete inspections accurately and on time, with quick access to critical data and task updates, even in low-connectivity areas.
Bio
Age
Location
Year of Service
Industry
Education
Age
Mumbai, Maharashtra India
8 years - QC and field inspections
Steel, Minerals, Oil & Gas
Bsc Metallurgy
Tech Proficiency
Challenges
-
Limited access to Laptop’s or PC.
-
Shift change communication
-
Images getting mix with personal data
-
Mobile app and desktop
-
Phone - Android/IOS
Preferred Features
Schedule Check and Task Tracking

Offline functionality
In-built Image capturing and upload
Real-time reporting
I’d be happy with just 15 extra minutes. Instead of finding a computer and re-entering everything, I could submit it all directly from an app.
So what device works best for our users?
ORIGINAL
Manual paper data entry on-site while validating from a printed document then reentering data onto an excel sheet and sending it via email to supervisor
Inspectors
Mobile device app with a single functionality to input data entry on-site and submit via the app.
IDEAL
-
Personal device app to avoid additional business costs of device.
-
Don’t need to have 2 devices on hand when at work.
-
Easy small device to use when on-site.
-
Single functionality to focus on primary tasks.
ORIGINAL
Assign inspectors to each inspection requirement via email and then review emails from each inspector with attached excel sheet and report documents to match and validate entries
Supervisor
IDEAL
Desktop enterprise app to assign inspectors, track inspection progress and approve reports while also tracking department progress and analytics.

Look & feel
I began sketching alternative interaction models to reimagine the portal’s navigation, aiming for a system shaped by user needs and work environments. The goal was to give both managers and field staff information at a glance, while reducing decision fatigue and making navigation effortless across desktop, tablet, and mobile.
Desktop view

2 Ft

1 Ft

Navigation
.png)
Tablet view

Preview / Assign


Use Case
Impact Canvas

Visual Design Process
Designing the visual system for the inspection app required careful consideration of the users’ environment—factory floors, field sites, and high-pressure industrial settings. The interface needed to feel lightweight yet durable, with every element serving a clear purpose.


Key User Tasks and System Interactions: Basic Use Case
Identifying Use Cases
Mapped actors, processes, and events to create functional scenarios
Selecting Task
Focused on tasks, covering a range of difficulty from simple to complex.
Defining Effective Tasks
Focused on tasks, covering a range of difficulty from simple to complex.


Assignment submitted successfully!
Can also assign multiple requests to a single inspector
Workflow
Supervisor assigns an inspector to a request
Once assigned, the inspector receives the request in their ToDo queue
Inspector app

Start an inspection when they reach on-site

Enter each parametric value

After all entries, last step will show a summary sheet with legends to show how many matched the tolerance level and how many didnt. Depending on that, the inspector can accept or reject and the submission will go to the supervisor.


Inspection Report submitted successfully!
Once submitted by the inspector, it reflects as completed on the supervisors portal where they can review the report and approve it.


Final Screens
Inspector’s Mobile App

Options


Time-stamped & tracked.

DM your teammate in-app
Re-assign your shift
Each step in the inspection flow focuses on one data point at a time—like API Gravity or Sulphur Content—to reduce cognitive load and allow for focused input. Tolerance ranges are clearly indicated beneath each field to help inspectors validate measurements in real-time. This eliminates second-guessing or the need to refer to external documents.


Office View: Track, Assign, and Review
While the mobile interface is tailored for on-site inspectors, the desktop experience is purpose-built for supervisors, managers, and operations leaders working from the office. It provides a comprehensive overview of ongoing inspections, assigned tasks, and invoice-related data — all in one place.
A key feature of the desktop dashboard is the “Runway” — a dynamic, right-hand panel that opens on click, providing deep context for each inspection without disrupting the user’s flow. This allows supervisors and managers to quickly access files, checklists, and observations tied to a specific record while staying anchored to the broader inspection list.

